Data on the disability community in King County reveals local disparities and the need for more representative data
Data about communities can be a powerful tool in understanding community needs, strengths and inequities. There is however a community often not visible in many data sources that almost everyone has a family member, friend, colleague or neighbor or they themselves are a part of: the disability community. Disability can affect how people move, think, feel, or communicate. People experience disability in many ways. Barriers in the world—like inaccessible buildings or information—can make those experiences harder.
Many different definitions of disability exist and they can be more inclusive or limiting, depending on context. Disability is defined in different ways in data, law, and lived experience. These definitions do not always match, and these differences can affect who is counted. Disability is not only about a diagnosis. People are often disabled by barriers in the world around them—like stairs without ramps, websites that don’t work with screen readers, or health systems that do not offer accommodations. In the U.S., disability rights are protected under the Americans with Disabilities Act (ADA) and Section 504, which require public institutions to ensure equal access.
An estimated 1 in 5 people in King County report living with a disability. This estimate likely undercounts some people with disabilities, due to how disability is defined and asked about in the survey, the exclusion of people that live in congregate settings like nursing homes, group homes and jails, as well as stigmas related to having a disability. Many people living with disabilities experience ableism— systemic, environmental, or attitudinal discrimination or bias— which often intersects with other inequities. In King County, older adults (aged 65+); residents identifying as lesbian, gay, bisexual, or transgender; American Indian/Alaska Native residents; Black residents; Hispanic residents; and veterans experience higher rates of disability than the county overall (figure 1). Disability prevalence also varies by place, with residents of South King County (24.4%) experiencing higher rates of disability and East King County (16.5%) with lower rates, compared to the county overall. Differences by place may reflect unequal access to health care, accessible housing, transportation, and other resources that support well-being.
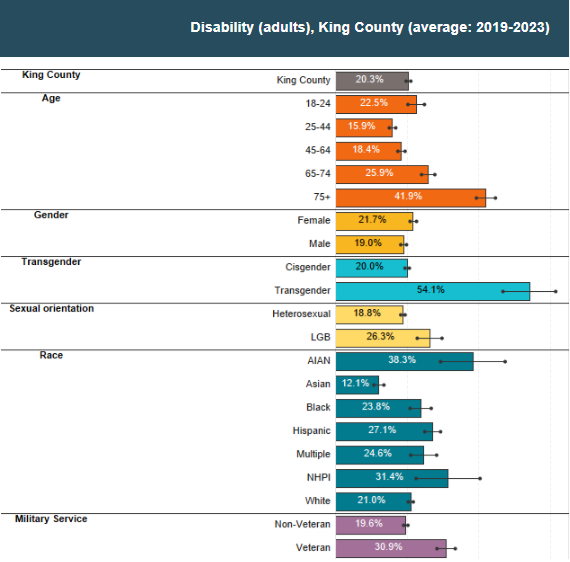
Figure 1: Estimated proportion of adults in King County living with a Disability by demographic group (2019-2023). Source: Behavioral Risk Factor Surveillance System.
One of the most substantial inequities experienced by people living with disabilities is economic security, where local data reflect substantial disparities. One-third (33.1%) of King County residents living with a disability have a household income below 200% of the Federal Poverty Level ($32,150 for a family of four), more than twice the rate of residents without a disability (15.8%). Over half of King County residents living with a disability have a household income less than $20,000 per year (figure 2). People living with disabilities may face substantial barriers to gainful employment or participation in the community through work, including ableism and lack of needed accommodations and supports. Policies such as strict income and asset limits for benefits like Supplemental Security Income (SSI) or Medicaid can make it difficult for people with disabilities to build financial security, even when they want to work. Barriers to employment are evident when we look at local data. About 10% of the King County labor force (aged 16+) living with disabilities is unemployed versus 4.2% among people without a disability. However, many people with disabilities are excluded from the labor force —often due to lack of accommodations, hiring discrimination, or benefit rules that can penalize earnings.
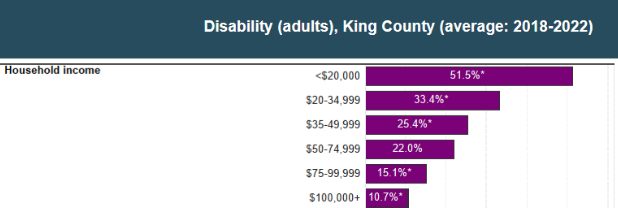
Figure 2: Household income among adults living with a disability in King County (average: 2018-2022). Source: Behavioral Risk Factor Surveillance System.
Individuals living with disabilities may experience challenges in the education system, including exclusion and discrimination, and may not receive needed accommodations and supports. Among adults aged 25 and older in King County, 35% of adults living with a disability had a Bachelor’s degree compared to 59% among those without a disability. 88.3% of adults with a disability completed high school versus 94.5% of adults without a disability. Among King County youth, 70.0% of students who received special education services graduated on time. Among students receiving Section 504 services for a disability 88.2% graduated on time, which is higher than the rate among students without disabilities (87%; figure 3). These patterns may reflect differences in how supports are provided across student groups and how disability services are identified and reported.
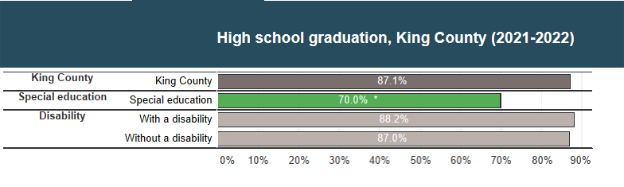
Figure 3: On time high school graduation rates among all students, and students receiving special education and/or Section 504 services in King County (2021-2022). Data Source: Office of the Superintendent of Public Instruction.
Transportation access is particularly important for the disability community. Transportation is a necessity for independent living and participation in the community including going to appointments, socializing, and commuting to work, but people living with disabilities may have access to fewer transportation choices. Some disabilities make it difficult or impossible to operate modes of transportation like a car or bike, and accessing public transportation may be difficult due to physical barriers like missing curb cuts, broken elevators, or buildings without ramps. Public transit options in many parts of the county may be limited, difficult to get to or require multiple transfers that can be difficult to navigate or require very long travel times. In King County, commuters with a disability (12.0%) were more likely to use public transportation to get to work than people without a disability (7.8%). People living with a disability (5.9%) were also more likely to walk to work compared to people without a disability (4.3%). King County residents with a disability (3.2%) were more likely to have a commute that takes 90 minutes or longer one way than those living without disabilities (1.8%).
When possible, breaking down data about a community by disability status can provide insights and reveal disparities on certain outcomes. Information about disability status, however, is often not collected or is collected in ways that exclude people living with certain disabilities through limited definitions or methods inaccessible to some people . Many data systems do not have supports like plain language, American Sign Language (ASL) interpretation, captions, large print, braille, or screen reader–friendly materials. When we do not provide accessible ways to share and receive information, people with disabilities may be less able to participate in data collection efforts—making inequities harder to see and address. A lack of comprehensive data collection can render people living with disability invisible in many data sources and makes it challenging to describe inequities, understand needs for resources, and act on potential areas of opportunity centering the disability community.
Practices such as relational and community centered data collection methods can help bridge data gaps and support information gathering. We can learn many things through developing better methods for understanding the lived experience of people with disabilities. In the forthcoming second blog of this series, we highlight ways that partnering with the disability community can support more inclusive and equitable data practices to empower communities.